


On the first screen of the software, we register the waveforms of the normal sound generated by the machine in motion in each operation mode in advance. Next, the software extracts the spectrum pattern (standard pattern) from the waveform using the LPC (Linear Predictive Coefficient) spectrum analysis.
On the second screen of the software, the software segments a waveform of the monitored sound generated by the machine in motion periodically and extracts the spectrum pattern (input pattern) from the waveform. Next, the software numerically evaluates the degree of likeness between the input pattern and the standard pattern using the similarity scale “One-dimensional GD”, and judges abnormality in the machine.
As a concrete example, the processing procedure is explained using a waveform of the motor sound in the following.
Processing Procedure
Registration of standard pattern:
On the first screen shown in Figure 1, we register a plural number of waveforms of the normal sounds generated by the machine in each operation mode (Clusters 2-14). Next, the software extracts the spectrum pattern (standard pattern) from the waveform using the LPC spectrum analysis. On the first screen, the spectrum image of the standard pattern is displayed and the sound of the waveform is output from the loudspeaker.
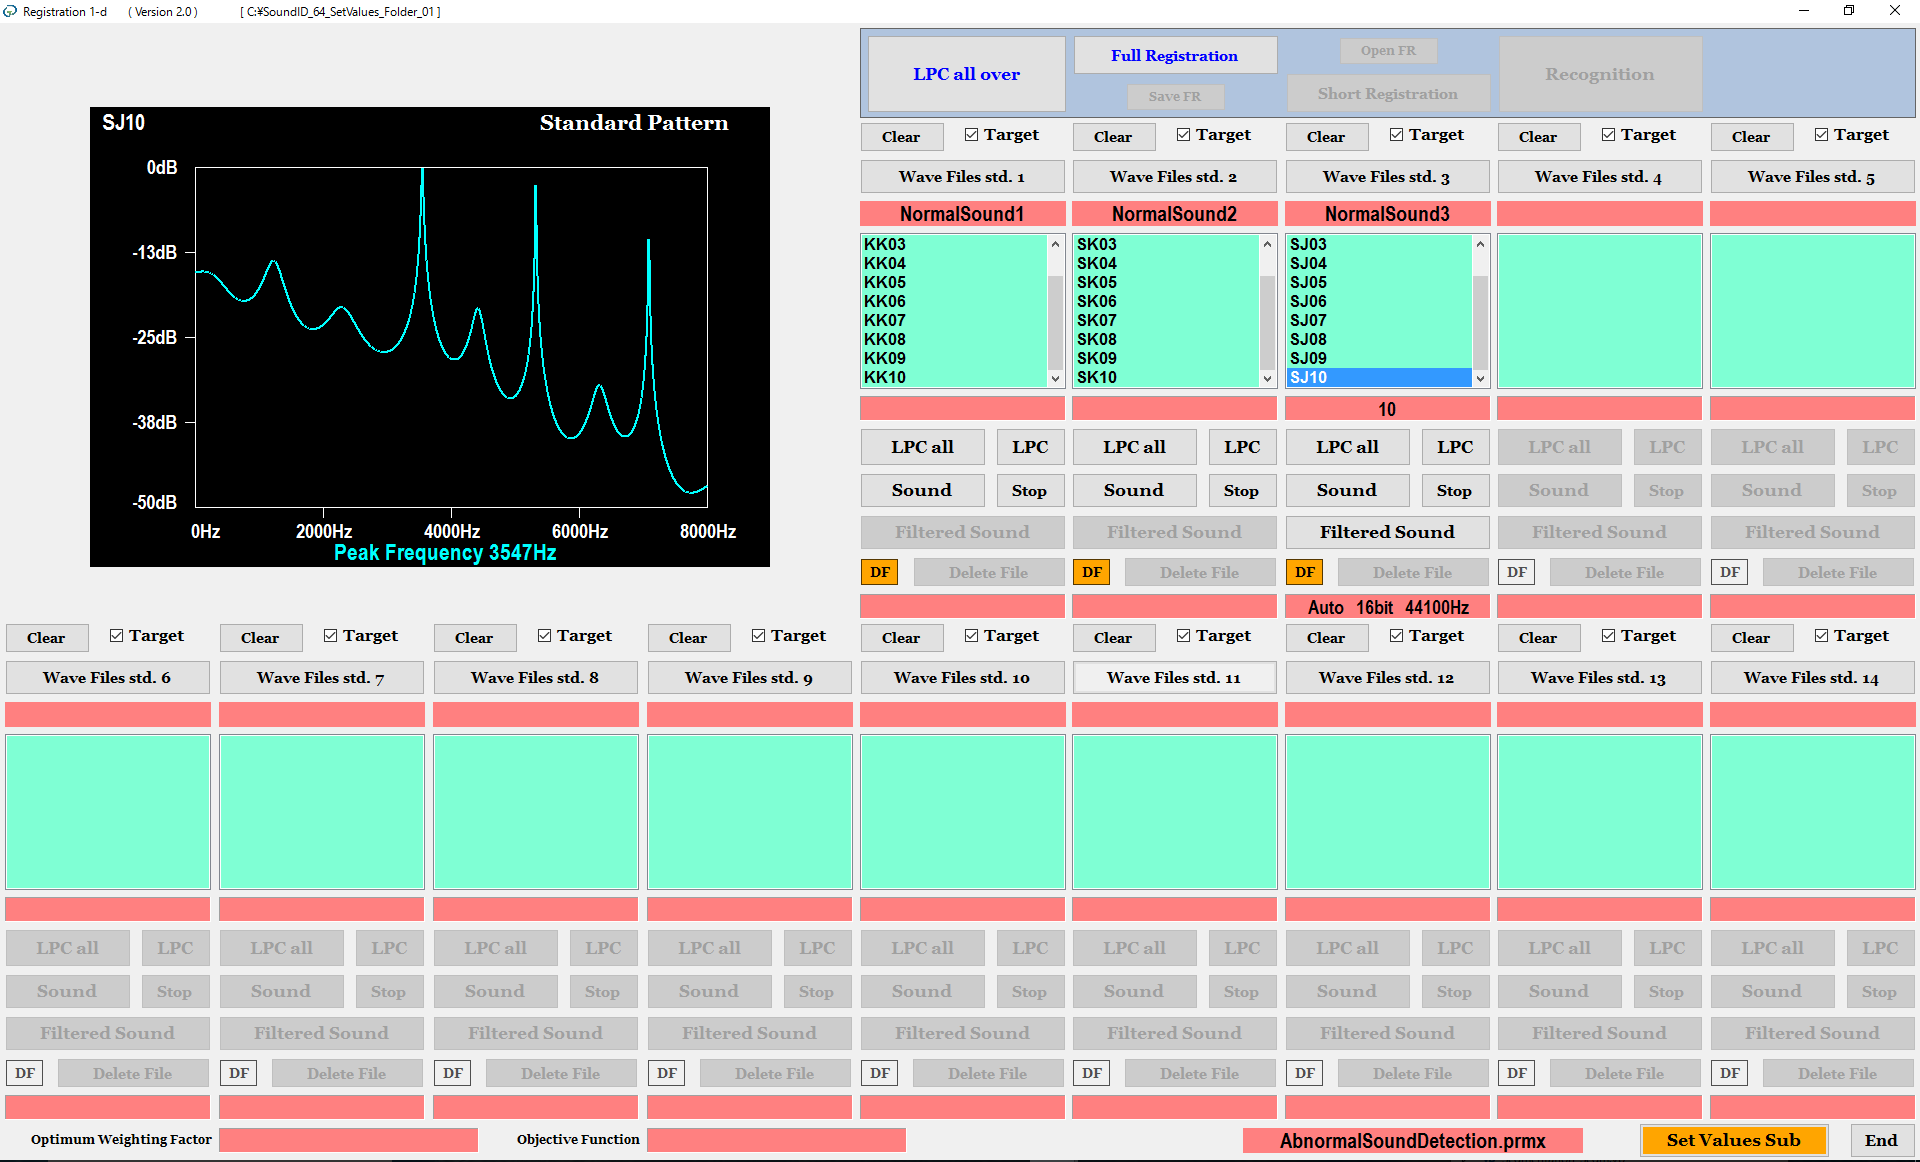
Registration of standard pattern (The first screen)
Detection of abnormal sound:
On the second screen shown in Figure 2, the software segments a waveform of the monitored sound generated by the machine in motion periodically, and extracts the spectrum pattern (input pattern) from the waveform. Then, the software displays the input pattern at the top of the screen.
Next, using One-dimensional GD, the software compares the spectrum pattern (input pattern) of the monitored sound with each of the spectrum patterns (standard patterns) registered on the first screen. Then, the software displays the standard pattern having the smallest distance from the input pattern at the middle of the screen. Furthermore, as a result of the recognition, the software displays the name of the standard pattern at the bottom of the screen. Also, the bar graph on the right shows the value of the smallest distance.
When the value of the smallest distance is greater than an arbitrary set threshold, the software judges wrong in machine because the monitored sound is different from each of the normal sounds.
On the first screen, we need to register normal sounds in all the operation modes. When you have some abnormal sounds, you may register them. If you do not have any abnormal sounds, then you do not have to register them.
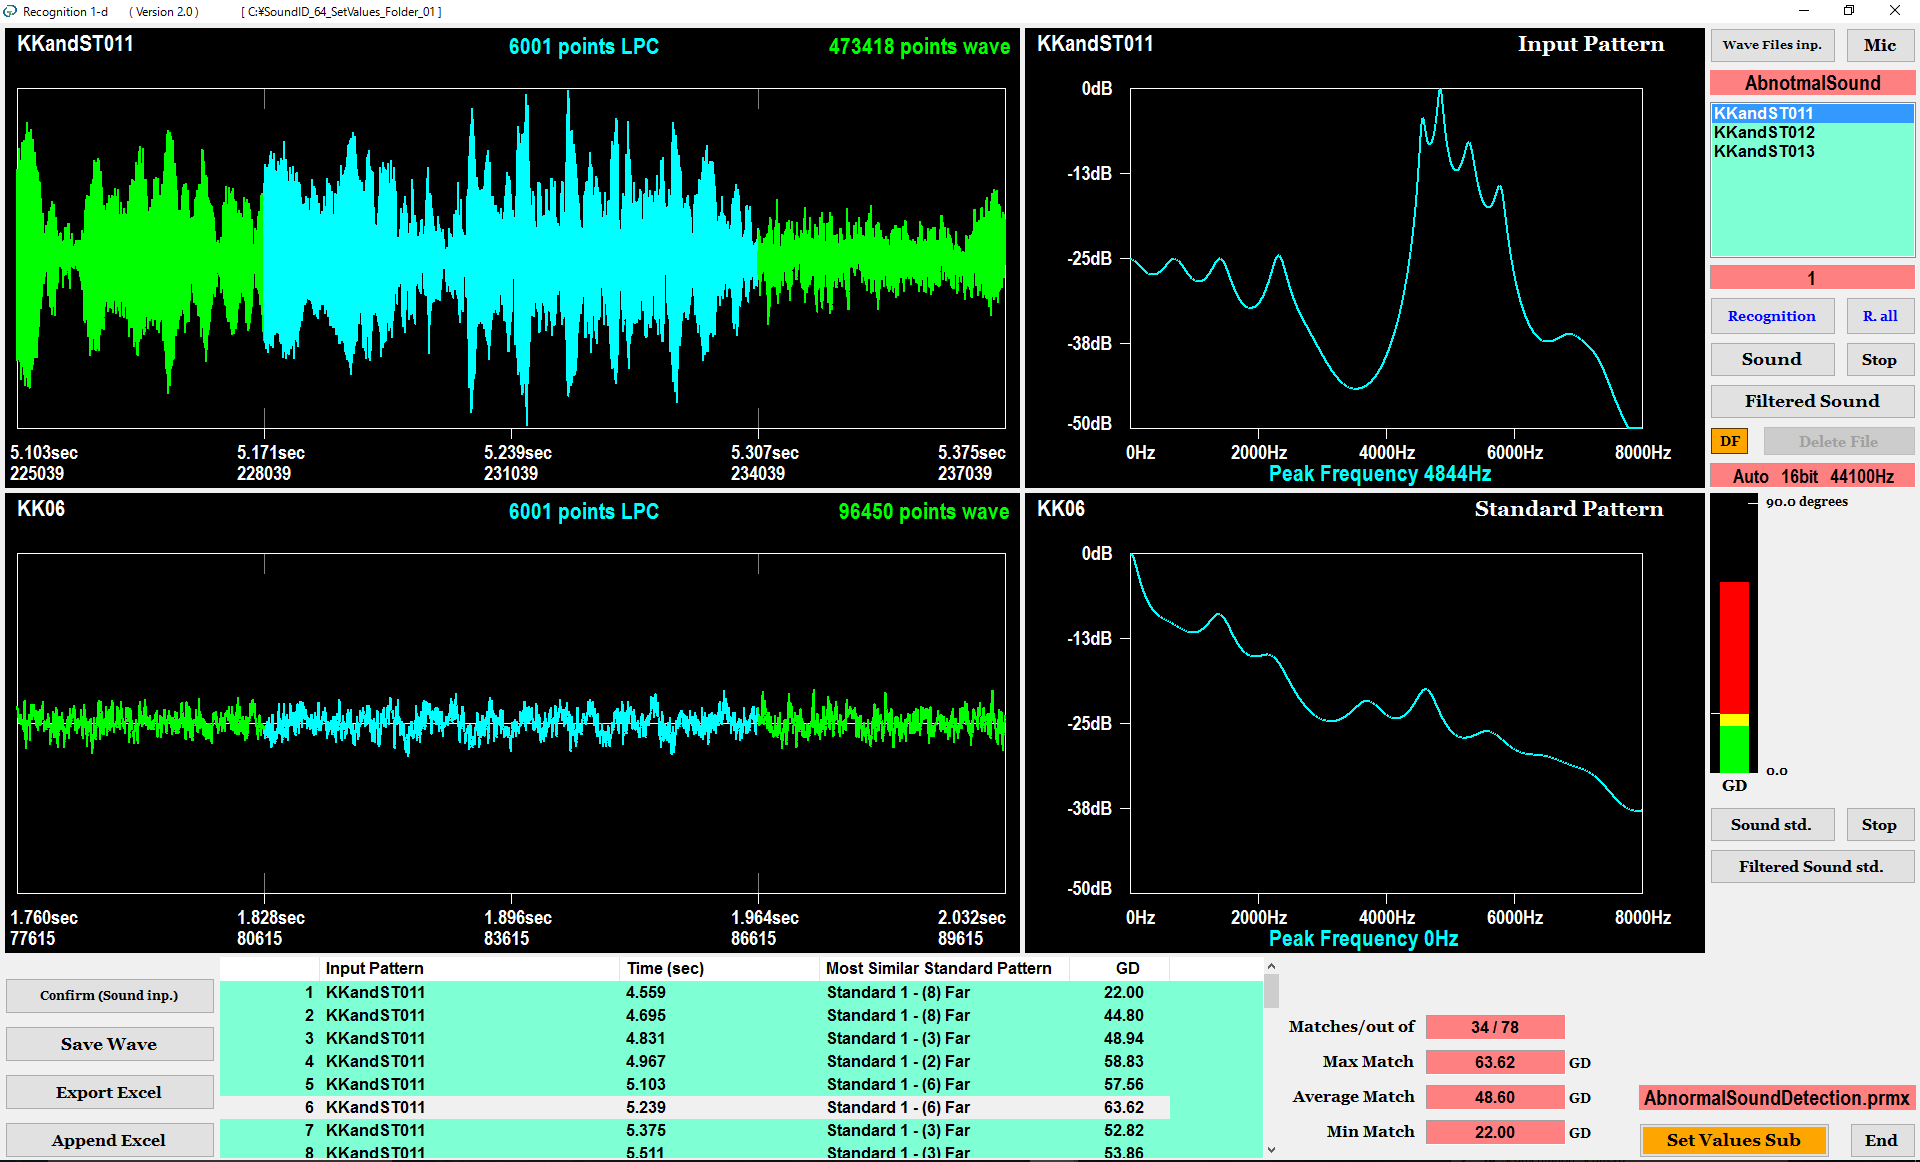
Detection of abnormal sound (The second screen)
